What’s the Score?

score board


Winter is finally over here in the northeast.  The ice is off the lake.  Spring is here.

And March Madness is over. There were some close games, even to the end. Can you imagine what this tournament would be like if they didn’t keep score?

It’s hard (and no fun) to play a game without knowing the score.  What’s the point of playing a game without keeping the score?   (Yes, I realize we should do some things for the joy of the game, but there’s a reason there aren’t too many “non-scoring” leagues.)

It’s the same in our businesses and professional careers.  I love asking business people, “How often do you perform your quarterly business reviews?” That’s your form of score keeping.

It’s not fair to ourselves just meander through the year and see where we end up.  We set goals and make plans.  We visualize results.  We measure against the results and reset goals and plans to improve performance.

I used to set annual goals, but now I set quarterly goals.  The shorter window helps me keep intensity and focus. So now I remind you: it’s the end of the first quarter and time to review your scoreboard.  Ask yourself:

  • As a business owner, manager and visionary, what are your numbers? For me, the score is generally the sales numbers, gross profit growth, segment profitability, EBITA (earnings before interest, tax, depreciation and amortization) growth, average revenue per invoice per customer, number of new customers, and developing scalability or stability, plus some other measures.
  • As a team leader, does your team understand the scoreboard? What will you do to help them push to maximize the score?
  • As a self-manager, what does your personal scorecard look like? Are you improving yourself and your life?

After you answer these questions and tally the numbers, you will find areas of improvement. The good news is, in most every business, there’s only a few things that you have to narrow your focus on to make solid headway. Find those vital objectives and leading indicators–your scoreboard should give you clues. We sometimes focus too much on the lagging indicators throughout the year–most of the time we should focus on the leading indicators and make them even better. Yes, give some attention to the areas that lag, but strengthen your strengths. You may find that eventually, the areas that lag may not need to be part of your long-term strategy anymore.

Now, do a solid financial close and look at the numbers – then set some goals for the next quarter.

I just looked at some of my goals I set in December. The scoreboard pointed out some wins, and some losses, some good results, some bad results, and some non-existent results (to be honest.) Not bad, but not exactly where I hoped to be on some levels.  I’m glad the first quarter is ending, and for me the score is fairly even, which gives me a decent base to shoot for more wins by the end of the next quarter.

I can help you do the same. Contact me.


Business Owner Mistakes: Not Developing a Strong Operating Plan


accounting plan


An operating plan is your complete financial forecast of where your business is going, including the income statement AND the balance sheet. It is more than just the typical budget I see at most of the companies I help.  Your operating plan helps drive and predict profit and cash flow. It shows your business leverage improvements and valuation changes.

When you own a business, it’s essential to know where you want to go financially. If you don’t know where you are going, any road will take you there. The better your forecast results, the more easily you can see the bumps in the road (hopefully avoiding them), the better you will perform, and the better you can predict the future. (And the better you will sleep at night!)

Your operating plan consists of these elements. For most small businesses, it’s about five pages:

  • Income statement (sales, operating margins, expenses.)
  • Balance sheet (what you own and what you owe)
  • Cash flow records.

Creating an effective operating plan is part art and part science.  The “science” is your historical results and the overall process to develop the document.  The “art” is everyone’s ability to predict anything. Face the fact that your forecasted numbers are going to be, by definition, wrong. Still, that doesn’t mean you don’t do them.

To build your plan, take these steps:

  1. Forecast the income statement. Do this on a somewhat granular level on a monthly basis.  Understand the revenue drivers and measure critical success factors; average sale per customer, transactions per service sector, inventory turnover, capital assumptions, etc.  Develop the sales plan we discussed before.  Understand product cost, gross margins, and production capacities. Estimate personnel needs to develop the personnel plan; know capital expenditure needs and timing.
  2. Forecast operating expenses.  This is generally a straightforward exercise, but be specific by month. We have a tendency to flat line expenses on the P&L which looks good on paper, it’s not the best way to accurately forecast.
  3. Reference your cash flow. The income statement with cash flow drivers and balance sheet assumptions auto-populate the forecasted balance sheet and cash flow statement.  Another mistake many business owners, entrepreneurs, and medical practices business offices make is they don’t understand the three basic financial statements.  Again I recommend looking at Dick Purcell’s book Understanding a Company’s Finances with the Financial Picture. Develop your ability to accurately track and foresee your cash flow.  (Click here for my resource page, with other helpful tools.)

Once you have built your plan, prepare a two-page summary of significant assumptions to prompt conversations with your team about strategies to improve these assumptions.

Don’t forget to compare your actual results with the operating plan. Compare the actual results to the plan’s income statement and balance sheet and the assumptions, analyzing all significant variances.  We use this instant feedback loop and what we learn to improve the forecast assumptions going forward and work on improvements.

Let’s be realistic, the better you can forecast, the better you see things coming; the better you will sleep at night.

This is a living and breathing process.

TIP: Remember small gains over time can lead to awesome results. A potentially simple idea to improve accounts receivable turn over can increase cash flow remarkably.  Here’s a spreadsheet that shows a $1.2mm improvement in cash with a 6 day accounts receivable turnover improvement.

Need more guidance? Contact me! Be sure to subscribe to receive my posts by email if you don’t already, or share with a friend!


Business Owner Mistakes: Not Managing and Predicting Cash Flow Precisely

Cash flow

We’ve all heard it: Cash is king.  Cash in business is like oxygen for business owners. Without it, a business dies.

I had a client who was profitable every month–some months more than others–but still profitable.  A large growth period, however, consumed all the client’s cash and they struggled to make payroll and vendor payments for eight months. We were eventually able to get additional financing to provide adequate working capital to offset the growth in accounts receivable.  We got a grip on accounts receivable and focused on improving accounts receivable turnover to get back to cash flow positive.  It took another several months to repair the vendor relationships.

On the other hand, I had a client that had been unprofitable for several years, but they had survived based on cash flow from current sales and from reductions in inventory.  Eventually, we scaled the business back, and we were able to get back to consistent profitability.

In both cases we had to face facts: cash flow is vital for survival, and not managing it or predicting it precisely can have devastating effects.

Here are a few tips you can use to help you be an expert in cash flow.

  1. Understand it.  Know where your cash flow comes from and where it goes.  Know the cash flow cycle in your business.  Cash receipts are from generally from sales regulated by accounts receivable, and cash disbursements are comprised of cost of sales items, payroll and payroll related costs, and operating expenses regulated by accounts payable and inventory turnover.
  2. Predict it.  Using your forecasted operating plan and a simple cash flow worksheet, develop a forecast process with your team.  Update and review on a weekly basis.  See more from a previous post here.
  3. Improve it.  Work to improve your cash flow numbers.  Improvement of cash flow comes from sales, accounts receivable turnover, inventory turnover, and accounts payable turnover.  Know your numbers and work to improve each one.  See my resource page for cash flow calculation tools.
  4. Protect it.  Consistency in sales and profit helps businesses predict and protect cash.  When our businesses generate extra cash, we need to pay down debt and vendors, and save it.  Excess cash seems to burn a hole in our pocket, and we look for ways to spend it.  We need to think more minimally. What do we really need and what should we invest in for future profits?  When things are good, put cash away for the eventual rainy day. It WILL come.

Get a handle on your cash flow and you’ll be able to breathe easier.

Need some help figuring this out? Contact me.  You may also want to read 7 Keys for Better Cash Flow, available to those who subscribe to my blog.

Stay informed. Improve Your Bottom Line

Financial Items

In another post, I provided a basic explanation of the three essential financial statements. Let’s go a little deeper to see another reason why they are so helpful.

It is interesting to me to observe the causal nature of certain business drivers and how small changes can over time can significantly affect cash and net income.  Many business drivers are interconnected through the financial statements.  For example, a strategy to improve inventory turnover can have a dramatic positive effect on cash (the balance sheet) and may have a positive or negative effect on profitability (the income statement), and a positive or negative effect on customer service through fill rates and on-time deliveries.

Understanding the basic financial statements is not only helpful for business owners for the obvious reasons, but can also aid in more in-depth scenarios like these, to name a few:

  • investors looking at a P&L
  • doctors running a medical practice
  • sales reps considering customer profitability and gross margin
  • accounting staff discussing the de-leveraging the company or evaluating credit worthiness of customers.

Simply put, understanding financial statements can help you ask meaningful questions and make well-informed decisions.

For example, I analyze P&L performance compared to the established business plan and to prior year results.  What were the sales and profit drivers vs. expected and compared to historical sales and profit drivers?  What were the expense fluctuations vs. expected, and what can be changed to improve results?

Similar for the balance sheet and cash flow statement, I look at the cash flow and liquidity metrics results to compared to expectation.  What improvements can be made for improvements for asset velocity and cash flow? How can we maximize effective leverage?  See my resources for some basic ratio ideas.

This information leads to small improvements over time which can yield incredible results.  For one client, I finished a small project with the goal to improve cash flow and reduce credit risk.  We put in a basic credit application process and worked to improve accounts receivable turnover.  Over the first four months, a one-person accounts receivable department improved their days sales outstanding average by five days.  Over the next year, she reduced accounts receivable turnover another five days.  Based on their growing top line with 100% open credit terms, they company had a $150,000+ positive impact to cash as a result of that small project.

Stay informed. Improve your bottom line.

How can I help? Contact me!

Be sure to subscribe to receive every post directly in your email!


But I’m not an Accountant!

financial statements

I recently conducted a workshop for start-up businesses and young entrepreneurs.  I was fascinated by their limited knowledge of the basic financial statements.

As an accountant by trade, I see how important it is for business owners to understand the three basic financial statements: the income statement, balance sheet, and cash flow statement. Grasping these allows owners to assess the company’s financial strength, maximize profitability and determine creditworthiness.

All companies should have solid closing procedures to get quick, accurate results, and they should spend time to review the financials in depth every month.

Here are the three basic financial statements, explained simply:

Income statement.  Also known as the P&L (Profit & Loss) statement, shows revenue, expenses and net profit over a certain period of time.  Net income is zero’ed out annually and moved to what is called “retained earnings” (which is another balance sheet account and basically means funds that you have set aside.)  At the beginning of the new year, you start pushing the ball up the hill again.

Balance sheet. This shows your assets, liabilities, and net worth at a snapshot in time.  It shows what you own and what you owe on a particular date.  The assets and liabilities are listed in ‘ease of liquidity’ order. Liquidity refers to how quickly you could turn those assets into cash.

Cash flow statement. This shows sources and uses of cash categorized by operating activities, investing activities, and financing activities. (In other words, income from sale, income from investing, and borrowed funds.)

These three statements will go a long way toward indicating the health of your company at any given time. To go further, you might want to take a look at a great book by Dick Purcell, Understanding a Company’s Finances with the Financial Picture by Dick Purcell.  I use Purcell’s concepts to show the basic business cycle accounting flow all the time.  A picture is a thousand words.  In his book he provides a diagram that does an excellent job explaining the basic financial statements.

I am always surprised by the business owner who doesn’t have a firm grasp on their numbers or who do not understand the balance sheet.  I hear, “I’m not an accountant” a lot.  Successful business owners understand their numbers.  They get the relationship with the balance sheet and cash flow statement.  They don’t tolerate a slow month-end close or inaccurate numbers.

Keep watch on your basic financial statements. They are vital signs to see how well your business is performing, and help you make needed modification to improve it.

Need additional help? Contact me. Be sure to subscribe to my posts to receive my free checklist, 7 Keys to Better Cash Flow.

The Dashboard May Be the Most Important Part of Your Company Vehicle

Five Keys to Make it a Great Part of Your Business

ca-dashboard

I believe Seth Godin said that all organizations are slow to change, but organizations that don’t measure the results are even slower to change.  He is one smart guy, and I 100% believe that – with organizations and people too.  We need to measure progress continually to make headway with everything we do.

I am a big believer in measurements and tracking key performance indicators.  I have logged my workouts every day (what I did, how long, in what intensity, how I felt, etc.) by day, every day for the last 20+ years.  I guarantee that if I hadn’t logged, I wouldn’t have been as consistent as I have been and I wouldn’t be in the physical shape I now enjoy.

With measures for your business or medical practice, I believe it’s the same thing.  Logging performance consistently over time improves results.  And small improvement steps over time have huge effects.

I track and review my client’s dashboards every week.  Some of my companies are always making dashboard tweaks and are quite advanced using automated dashboards with Tableau and Cognos, and others are quite simple using a whiteboard or Excel graphs manually prepared. I think of business measures like a car’s dashboard. Tracking a few meaningful key measurements is important.  The car’s dashboard doesn’t measure the 100’s of things going on with your vehicle, but it does track important things like speed and the amount of fuel left. Experts agree that business dashboards should illustrate financial health, operational efficiency, and quality (quality product in business or quality patient care in a health care environment, for example.)

I think of business measures like a car’s dashboard. Tracking a few meaningful key measurements is important.  The car’s dashboard doesn’t measure the 100’s of things going on with your vehicle, but it does track important things like speed and the amount of fuel left. Experts agree that business dashboards should illustrate financial health, operational efficiency, and quality (quality product in business or quality patient care in a health care environment, for example.)

Here are a few things I’ve learned over the years by implementing key performance indicators and dashboards:

Key 1: Keep it simple.  Keep the measures limited. I like one-page dashboards.  Ensure all measures focus on your vital few objectives (ref post from early 2016).  Data needs to be easy to obtain and completely objective.  Ideas: sales growth, customer/patient acquisition/retention/loyalty, operational productivity measures, gross profit, debt ratios, asset velocity metrics, etc.

Key 2: Measure the right things.  Just because you can measure it, doesn’t mean you should measure it.  Again, think of your car’s dashboard.  The higher up the food chain the dashboard user is, the less information is needed.  The board of directors, for example, generally aren’t interested in the number of mistakes made by the fabrication shop—only in the big picture.  Always align measures with your company’s or practice’s goals, vision, and direction.  It’s not a very good idea to regularly change specific measurements, but don’t be afraid to make changes to ensure your measuring the most meaningful metrics to track over time.

Key 3: Be consistent. Dashboards need to be produced and reviewed consistently to get buy-in and provide useful results.  The measures you track generally have positive results and trends go in the right direction over time.  I like dashboards to be produced and reviewed on Monday for the previous week.

Key 4: Keep results visible.  This is so important. I’ve made this mistake several times. I developed great tracking graphs, but inconsistently (or never) brought them out for review or discussion.  Visibility helps everyone understand results and where the company is headed.

Key 5: Set realistic targets.  Dashboards are easy to get started, but take diligence and discipline to maintain their accuracy and value. I use reminders, tasks, and calendar appointments to keep consistent, but it helps a lot when a company is results-oriented.

Which of the above do you need the most help with? Contact me!


The Cash Flow Worksheet

financial items

As I discussed in a previous post, the Cash Flow Worksheet from the financial side of the company is the windshield.  It allows us to look forward.  Business owners and finance pros use this weekly tool to forecast cash sources and uses.  It dramatically helps predict cash flow opportunities and see cash landmines down the road.  It will provide excellent data points for improvement and helps you improve forecasting your results.

For most of the companies I work with, cash can be tight.  We watch it carefully, managing it to minimize interest expense and see cash crunch holes.  The cash flow tool I use for the process is mostly manual, but straightforward and only takes about 30 minutes per week to update and review.

Let’s take a closer look.  Download the 13 Week Cash-Flow-Tool.

The worksheet is broken out into three distinct sections by week. Billings, Cash Receipts, and Cash Disbursements.  12 months of cash disbursements are forecasted by week with 100% of the accounts payable accounted for with estimates made for recurring payments, forecasted operating expenses, production costs, and  inventory needs.  Use forecasted manufacturing and cost of sales percentages, if that makes sense for your business.

It is updated weekly with actuals compared to estimated figures to improve forecasting.  After a few months, it gets much easier.  Develop an easy process to get actual numbers on Monday for the prior week’s activity.  For companies I work with, I have them complete a daily report to track cash ins and outs.

Worksheet Details

  1. Billings– Forecast your weekly billings,  by customer or business segment (helps if it’s not too detailed.)
  1.  Cash receipts: You need a methodology for forecasting your cash receipts.  Predicting cash receipts depends on the type of business. It can be relatively simple and straightforward if you have 10 prime customers or it can be complicated with 100+ customers.

In either case, predicting cast receivable turnover is not an easy task.  I generally use a 6 week rolling average of accounts receivable turnover, but for most cases larger customer activity needs to be considered. Focus on reducing overall Days Sales Outstanding (DSO)–the return here can be huge.

  1.  Cash Disbursements 

Look at your accounts payable and actual payment history over the last few months.  Establish estimated weekly amounts and due dates by summary category.

Operating expenses

  • Payroll
  • Medical benefits
  • Occupancy
  • Rent
  • Taxes
  • Insurance
  • Principal and interest – debt schedule for each
  • Lease payments
  • Marketing
  • Travel
  • Etc.

Inventory and Cost of Sales Items

  • Product for sale
  • Material
  • Production Costs
  • Outside services
  • Packaging
  • Freight out
  • Other Cost of Sales costs

Capital expenses

  • Equipment purchases
  • New product development expenses
  • Other business investments

The worksheet rolls cash forward each week.  Comparing to actual results weekly improve forecasting accuracy.  Any negative cash weeks will need to be cured with a draw on your lines or delay in payments. This is where you spot cash crunch holes and address shortages well in advance.

Here is a sample Cash Flow Checklist that you can use to develop your own process.

Contact me for help in setting up processes that work for you!

The 3Q Push: Be Successful When Small So You Can Grow Big

Windshield

September is here. It’s time for the Q3 push to finish the year strong.

I hope your August financial statement are closed by now.  If not, focus on getting them done this week by looking at the rear-view mirror and the windshield.  Don’t just “roll the dice” when it comes to your business.

Rearview Mirror 

Look at your monthly historical income statements, each month side by side.  Are your revenue and expenses tracking as planned?  Can you make improvements?  Look at each revenue segment. Can you do better?  Sort your expenses in descending order. Where are the opportunities to do better? Compare to the planned expense amounts and answer some “Why?” questions.

Windshield

I hope you are also updating your 13-Week Cash Flow weekly.  This practice helps you look forward. Are your planned cash receipts and cash disbursements tracking as planned?  Be realistic here. This is a good place to spot both opportunities and land mines.

With this data in mind, recast your projections and your 13 Week Cash Flow with better data to finish the year strong.

Be Successful when Small so You Can Grow Big

I work with business of all sizes.  Working with smaller companies that are growing, I tell owners they need to be successful when they are small so they can grow big. That is a great statement that encourages small businesses as well as inspires larger companies.

It’s also a potentially scary statement for the small businesses that have big ideas (or $50mm in start-up funding.) I see startups that have been seeking capital for years and who don’t have any consistent revenue. They think, “We need to get to ‘x’ before we are going to be successful.”  Guess what? Those guys generally fail. According to SBA, 50% of small business will fail in the first year; so the five-year survival rate is low.

Businesses fail because:

  • They can’t pay their bills.
  • They don’t have enough customers.
  • Customers are not buying what they are selling.
  • They can’t attract paying customers.
  • They can’t find great employees.
  • They don’t have sufficient capital resources.
  • The business systems aren’t working effectively.
  • And other things.

Many small businesses I see today are barely keeping their head above water.  The ship has holes in it, and the water level is constantly rising.  We need to focus on the basics such as sales growth, customer profitability, and new customers, establishing policies, procedures, and systems that are sustainable, thorough and efficient. One of those procedures needs to be the steps I’ve already outlined above!

Take time today to set your next quarter goals and targets now to finish the year strong.

Post Script on the Triathlon

Quick update on the Triathlon I did in August.  At the end of the day, I glad I did the race and I am extremely happy with my performance in the event even though I didn’t hit my goal time.  I had a horrible swim. As the race got started, the high south wind had kicked up whitecaps on the lake. Although I’d been swimming since February relatively consistently up to 3-4 times per week, I really laid off swimming in the summer.

I was organized. My equipment was correctly set up in the transition area, I had a solid running and swim warm-up, and I was pretty calm.  After a great start and about 3/4 into the first of two legs on the swim, I got a mouth full of water.  From that point on, I had trouble keeping my head in the water.  I would count my strokes, focus on my form, but after a couple of strokes, I would panic.  I’ve had this happen before, but I thought my pool training would be enough.  It wasn’t.  My swim took 25 minutes.  Horrible.  The other two events went pretty well and my transition times were solid.

At the end of the day, I was happy I did it. But I missed my goal time due to the swim.  I was feeling very disappointed in my overall performance, but then it occurred to me during the run that expectation and reality meet at some point.  We shouldn’t feel disappointment.  We should accept reality, and feel grateful and content.  The happiest people ‘they say’ are grateful for where they are.

The initial thought is to reduce expectation, but is that the point? Should my goal then be just to do the triathlon with no goal time?  “A finish is a win” attitude? Not for me. I need to get my butt out there and do some open water swimming.  Get stronger and better.  That’s the point of stretch goals.  Stretch goals make us continually up our game.

The Second Half is Underway!

In many sports games, especially for the team currently losing, the second half (or some other division such as inning or quarter) feels like a fresh start in the middle of the overall fight to win. We are at that point in the year where we can take a look at the start of the “second half.”

So, how has the second half started for you and your business?

Hopefully, you’ve been having a great summer and took some time for ‘half-time’ to consider how you and your business performed in the first half.

Half-time is over now, and the second half is starting to move fast.  If you haven’t already done so, spend some time this week to get solid performance data and start developing a revised second half-year business plan.   Get your Q2 Team Meeting on the calendar for August!

I’ve been spending time with my clients doing much of the same. We’ve been wrapping up the quarter and the first half year, getting cash flow and business drivers’ actual results, updating the 13-week cash flow forecasts, and setting up meetings to talk with their lenders and shareholders about the results and targets.

We always need to be looking at the instrument panel and make adjustments as we go.

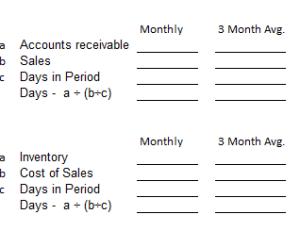
For one of my newer clients, we measured accounts receivable and inventory days and graphed the last 18 months.  We noticed some turnover creep and developed strategies and goals to improve that issue.

Let me give you some help for calculating your own turnover days. Here’s a simple worksheet.

worksheet

I generally use the three-month average for my calculations.  The calculations show how many days, based on history, that it takes for accounts receivable or inventory to turn into cash.

The powerful thing is the cash generated by reducing the days.  Say your company does $5,000,000 in annual revenue and has consistent sales approximately of $400,000 per month with 32% gross margins.  Your accounts receivable has averaged 42 days and inventory has averaged 52 days for the last year.  If you develop strategies and measures to bring down the Receivable and Inventory turnover days each by 4 days, you will put $90,000 of cash on your balance sheet.  Imagine a 10 day improvement and if you’re a $10mm business with the same improvements as in the example above, that’s $180,000 increase in cash!

Now that we only have four months of the year left, it’s also time to refocus on the year’s intentional goals and continue pushing and developing tactics to hit those targets.

Ensure your June’s financials are closed, and you have good business performance data (Sales and gross profit by segment, by customer, by sales rep, etc.)  Ensure all projects are focused and moving forward–if they’re behind schedule, you need to set new targets or get them back on track.  Things have changed since you developed your initial plan.  Make the changes in your projections, and develop your second half business plan.

A good part of running a business is regular evaluation of where things stand, and where/when it’s time to make adjustments. The calendar provides regular markers for activities like these, but it’s up to YOU to take the time to consider and implement what steps you need to take!

How to Effectively Play the 80/20 Game

I was re-reading the 4-Hour Workweek by Tim Ferriss the other day, and he mentioned how he stumbled on the Pareto Principal and how it changed his life.  Vilfredo Pareto (1848-1923), an Italian economist-sociologist, concluded that there are unequal relations between inputs and outputs and 20% of invested inputs is responsible for 80% of the results obtained. In other words, 80% of the results come from 20% of the causes.  The main takeaway? A few things are important; most are not.

The reasonable man adapts himself to the world. The unreasonable one persists in trying to adapt the world to himself. Therefore all progress depends on the unreasonable man.  ~ George Bernard Shaw

The 80/20 Rule has been teased out over the years and significant research has shown that it applies to all sorts of situations:

  • 80 percent of results come from 20 percent of efforts
  • 80 percent of activity will require 20 percent of resources
  • 80 percent of usage is by 20 percent of users
  • 80 percent of the difficulty in achieving something lies in 20 percent of the challenge
  • 80 percent of revenue comes from 20 percent of customers
  • 80 percent of problems come from 20 percent of causes
  • 80 percent of profit comes from 20 percent of the product range
  • 80 percent of complaints come from 20 percent of customers
  • 80 percent of sales will come from 20 percent of sales people
  • 80 percent of corporate pollution comes from 20 percent of corporations
  • 80 percent of work absence is due to 20 percent of staff
  • 80 percent of road traffic accidents are cause by 20 percent of drivers
  • 80 percent of a restaurant’s turnover comes from 20 percent of its menu
  • 80 percent of your time spent on this website will be spent on 20 percent of this website
  • and so on..

Think about it–the implication of the 80/20 Rule is that output cannot be just increased, but multiplied if we could make the low productivity input nearly as productive as the highly productive inputs.  This way of thinking is not always easy or intuitive, but consider the implications in your business, your free time, and your relationships.

The 80/20 theory is useful for any company, but it must not be interpreted too rigidly or deterministically.  The principles work because they are reflection of the relationship in nature, an intricate mixture of order and disorder, regularity and irregularity. The art of using the 80/20 Rule is to identify which way the grain of reality is currently running and exploit that as much as possible.

The game is to spot the few places where you’re making great surpluses to maximize them and identify the places where you are losing and move away from those areas.

Unless you have used the 80/20 principle to redirect your strategy, you can be pretty sure that your strategy is flawed.  Take a look at your customers, your products, your suppliers, your business processes, and your customer service issues.  Take a stab at applying the 80/20 Rule with question slike:

  • Which customers and products are accounting for the 80% of our profit?
  • What customers are causing 80% of the pain?
  • How much profit are the “painful” customers actually generating?

I’ve created a great Excel tool to log problems areas (I initially used it to log billing problems which were ultimately reduced by 75%.) Help yourself and let me know what you discover!

Verbeck Associates Pareto Chart