
We are all hustling to close our financial statements for last year. The auditors are coming in for their year end fieldwork. 2015 plans are being finalized with January as a bench post.
Seriously, by now most of us small and medium sized business owners have their internal year-end financials in hand (or half-year if you are a June 30 year-end) with your 2015 projections. If you don’t have yours year-end financials in-hand, get them done as soon as possible! If you don’t have an audit or a review by external accountants, prepare you books as you do. A solid year-end close is essential. Clean out the closets.
First, ensure all month-end procedures are complete and all balance sheet and income statement accounts are completely reconciled. Solid monthly closing procedures ensure timely and accurate month-end numbers. If this is an issue for your company, definitely make this an improvement goal for this year. A quick, accurate close is essential to run your company effectively. It’s impossible to make smart decisions without accurate numbers. If back end systems and processes are in place, the close process is clean and you can look at the critical numbers real-time.
Anyway – February is also a great time to look at your numbers. Monthly, business owners should compare actual month-to-date and year-to-date results to budget and to prior year. At year end, it is a great time to look at other key statistics as well.
For most businesses, I like to look at:
- Number of invoices for the year.
- Average invoice amount – calculated as: revenue ÷ number of invoices.
- Number of customers that bought from you last year.
- Average revenue per customer – calculated: revenue ÷ number of customers.
- Transactions per customer – calculated: revenue ÷ number of customer ÷ average revenue per customer.
Once you have these actual numbers, drop them into a spreadsheet as follows:
| Basic Business Model | Actual per Year | Next Year Plan |
| Leads | 1,000 | |
| Conversion Rate | 80% | |
| Customers | 715 | 800 |
| Transactions per year | 24.00 | 24.00 |
| Average revenue per invoice | $ 246.00 | $ 300.00 |
| Revenue | 4,221,360 | 5,760,000 |
| Margin | 34.0% | 35.0% |
| Gross Profit | $ 1,43,262 | $ 2,205,000 |
| SG&A | $ 1,100,000 | $ 1,100,000 |
| Net income | $ 335,262 | $ 916,000 |
Note the small improvements in number of leads, conversion rate, and average transaction value have a huge increase in profitability. If you can increase the number of transaction per year, even better. I also like to track customer churn and work on strategies to decrease attrition.
Also, look at sales and gross margin by business segment and by customer. Several techniques can be used to including summarizing customer data in a matrix as follows.
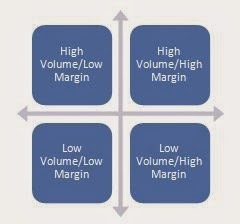
Work to move customers from the LV/LM quadrant.
Also, business owners need to review their balance sheet. Many small and medium sized business owners skip or skim over the balance sheet. Remember, the balance sheet is a snapshot in time of what your company owns and owes.
Important items on the balance sheet include leverage ratios, accounts receivable turnover, inventory turnover, and accounts payable payment days. All are straight forward calculations.
Note the power of cash flow with the follow example:
If you are a $20mm business with $2.2mm in accounts receivable, a 5-day improvement in receivable turnover means a $274,000 incremental increase in cash flow.
Several strategies can be employed to improve turnover statistics.
This is also great time to take another look at your upcoming year’s strategic plan and operating forecasts. Consider using some of these techniques to set monthly targets and goals.
If you need any help looking at your numbers, let me know – I love helping business owners improve their businesses.
As always – Think Profit!
/jon
Please note: I reserve the right to delete comments that are offensive or off-topic.