


I believe Seth Godin said that all organizations are slow to change, but organizations that don’t measure the results are even slower to change. He is one smart guy, and I 100% believe that – with organizations and people too. We need to measure progress continually to make headway with everything we do.
I am a big believer in measurements and tracking key performance indicators. I have logged my workouts every day (what I did, how long, in what intensity, how I felt, etc.) by day, every day for the last 20+ years. I guarantee that if I hadn’t logged, I wouldn’t have been as consistent as I have been and I wouldn’t be in the physical shape I now enjoy.
With measures for your business or medical practice, I believe it’s the same thing. Logging performance consistently over time improves results. And small improvement steps over time have huge effects.
I track and review my client’s dashboards every week. Some of my companies are always making dashboard tweaks and are quite advanced using automated dashboards with Tableau and Cognos, and others are quite simple using a whiteboard or Excel graphs manually prepared. I think of business measures like a car’s dashboard. Tracking a few meaningful key measurements is important. The car’s dashboard doesn’t measure the 100’s of things going on with your vehicle, but it does track important things like speed and the amount of fuel left. Experts agree that business dashboards should illustrate financial health, operational efficiency, and quality (quality product in business or quality patient care in a health care environment, for example.)
I think of business measures like a car’s dashboard. Tracking a few meaningful key measurements is important. The car’s dashboard doesn’t measure the 100’s of things going on with your vehicle, but it does track important things like speed and the amount of fuel left. Experts agree that business dashboards should illustrate financial health, operational efficiency, and quality (quality product in business or quality patient care in a health care environment, for example.)
Here are a few things I’ve learned over the years by implementing key performance indicators and dashboards:
Key 1: Keep it simple. Keep the measures limited. I like one-page dashboards. Ensure all measures focus on your vital few objectives (ref post from early 2016). Data needs to be easy to obtain and completely objective. Ideas: sales growth, customer/patient acquisition/retention/loyalty, operational productivity measures, gross profit, debt ratios, asset velocity metrics, etc.
Key 2: Measure the right things. Just because you can measure it, doesn’t mean you should measure it. Again, think of your car’s dashboard. The higher up the food chain the dashboard user is, the less information is needed. The board of directors, for example, generally aren’t interested in the number of mistakes made by the fabrication shop—only in the big picture. Always align measures with your company’s or practice’s goals, vision, and direction. It’s not a very good idea to regularly change specific measurements, but don’t be afraid to make changes to ensure your measuring the most meaningful metrics to track over time.
Key 3: Be consistent. Dashboards need to be produced and reviewed consistently to get buy-in and provide useful results. The measures you track generally have positive results and trends go in the right direction over time. I like dashboards to be produced and reviewed on Monday for the previous week.
Key 4: Keep results visible. This is so important. I’ve made this mistake several times. I developed great tracking graphs, but inconsistently (or never) brought them out for review or discussion. Visibility helps everyone understand results and where the company is headed.
Key 5: Set realistic targets. Dashboards are easy to get started, but take diligence and discipline to maintain their accuracy and value. I use reminders, tasks, and calendar appointments to keep consistent, but it helps a lot when a company is results-oriented.
Which of the above do you need the most help with? Contact me!

My grandmother used to say the phrase “Rabbit, rabbit, hare, hare” every month when she flipped her Travelers Insurance calendar from one month to the next. She would say it was for good luck. Apparently, this was adopted from an old English superstition from the 1200’s for good luck. I’m sure others chant this expression at the beginning of a new month for good luck as well.
I still follow the superstition to this day. My family says “Rabbit, rabbit, hare, hare” 10 times in a row, first thing in the morning, for good luck. My 84 year old mother (who lives in Chicago) and I have a contest every month: who can send the first “RRHH” email. You would think since I get up at 5 AM every day and live in the east, I would win every time, but not even close.
I took a few minutes on Sunday morning and thought about “Rabbit, rabbit, hare, hare.” I thought about how fast the last month went! We had an outstanding October weatherwise in the Northeast; I just finished a four day juice cleanse; and I purged my garage, filling a dumpster and donating several loads of household items. I thought about the good things that happened all month and how grateful I am for it.
Now I turn to November. The beginning of a new month is always a great time to make sure you’re moving the ball down the field in the right direction.
This November 1st after my “RRHH” rituals, I was thinking about the runners at the start of the NYC marathon. I was very happy I didn’t run it this year though it truly was one of the most remarkable experiences in my life (circa 1997). But while watching my friends run it this year it became clear to me. In 2016 I’m definitely signing up for one competitive event. We need specific goals and aligned goals to take things to the next level. For me, I want to get my fitness to the next level so I’m signing up for a race. Simple. Aligned goal.
It’s the same way with our other goals. We need to set specific aligned goals to take things to the next level.
As a business owner there is a lot to do with only 60 days to finish 2015 strong: hammer on your Q4 goals, solidify your 2016 business plan assumptions and game plan, do your consisting weekly 13-week cash flow forecast, etc. This week, take a look at where you are with your 100 day plan we talked about here and determine exactly where you are with your initiatives. For me, I’m way ahead in a couple goals and behind in others.
Let’s prepare to finish strong!
Bonus: Also, this week I put together a very quick screen cast of how to use the SUMIF formula in Excel. I use it all the time to summarize Excel data. It’s super easy and if you use Excel you need to know how to use it. Watch Video
Need help with your company finances? Contact me. Let’s talk!

The 3rd quarter ended this week. Us finance guys are hustling to get the month and the quarter financial statements closed, and get the financial reports issued. Business owners are chomping at the bit to see their results. Bankers want to see the numbers to see how things are going and hoping for no surprises. The sales guys are already into the 4th Quarter, digging to make their annual targets.
How is your business doing so far? I see a lot of companies that don’t know the answer to that questions. I hope you do.
We need to focus on getting the Q3 results in the books ASAP, and we need to start thinking about 2016 budgets and operating plans.
We need to start with a solid benchmark and a quarter is a great time to do that. Q3 especially.
So here’s your list:
A quick and solid Q3 close is essential for many reasons:
Two things can really make a difference making the close process better:
Sounds simple, but I see it all the time. The numbers are not updated daily and/or there is no closing checklist or documented close process. These are simple steps, but they make a huge difference for accurate financial reporting.
Push your Q3 close process now to get accurate numbers fast. Use a closing checklist and focus on getting each item done accurately and quickly. This will help you immensely with the overall results for your business.
Well, how has the 2nd half started for you and your business?
Hopefully, you had a good summer and took some time for ‘half-time’. Half-time is now over, and the second half is already moving fast. I hope you took some advice from the previous posts and you have solid data and a revised second half-year business plan in hand. If you don’t – spend this next week getting these elements wrapped up. Did you have your Q2 Team Meeting as discussed previously? If not, get it on the calendar!
I’ve been spending time with my clients doing much of the same – wrapping up the quarter and half year results, getting July financials wrapped, getting cash flow and business drivers actual results, updating my client’s 13-week cash flow forecasts, and talking with their lenders and shareholders about the results and targets.
We always need to be looking at the instrument panel and make adjustments as we go.
For one of my newer clients for example, we measured accounts receivable and inventory days and graphed the last 18 months. We notices some turnover creep and developed strategies and goals to improve turnover.
For these two measures, I first see which data points I’ll use: Monthly data or a 3 month rolling average. Choose one and stick with it.
Here’s a simple worksheet to calculate your turnover days.

The interesting thing is the power of reducing the days. For example in fictitious land, say your company does $5,000,000 in annual revenue and has steady sales of $400,000 per month with 32% gross margins. Your accounts receivable has averaged 42 days and inventory has averaged 52 days for the last year. If you develop strategies and measures to bring down the turnover days by 4 days, you will put $90,000 of cash on your balance sheet. If you’re a $10mm business with the same improvement, that’s $180,000!
Generally, I use the 3 month average for my calculations. The calculations show how many days, based on history, does it take for accounts receivable or inventory to turnover. Graph the last 18 months to get your base line. I do this monthly – measure actual to plan.
Now that we only have 4 months of the year left, it’s time to refocus on the year’s intentional goals and continue pushing and developing tactics to hit those targets.
Ensure you have good data and all projects are focused and moving forward – if they’re behind schedule, get them back on track.
I’ve got to get going now and get some of mine back on track.
Think Profit!
I’ve been using a cash flow process for all of my clients for years. It helps business owners get a handle on their cash situation – be prepared and get in control. We meet on a weekly basis and go through the 13-Week Cash Flow worksheet. We review results for the prior week and recast the next 13-Weeks. Simple, but very effective.
When you first start using the process – it’s awkward – scary – and most likely inaccurate.
I first started using a 13-Week Cash Flow process with a company I owned – primarily out of fear. We were a small company with 12 employees. Every week, we’d freak out about how to make payroll and pay our bills. The insurance bill in August almost put us out of business. We made the typical mistake of reducing our salaries to reduce payroll. Several times had come out of pocket to cover payroll and vendor bills. We were growing our sales revenue, and we were profitable – but it was very very stressful and not very much fun.
We started using a 13-Week Cash Flow process. A very simple concept tracking inbound and outbound cash on a weekly basis. We started monitoring/tracking/predicting cash ins and outs on a daily basis for the first 4 weeks, then weekly for the other 12 weeks. We’d predict cash receipts and accounts receivable turnover. We’d schedule out all cash disbursement – payroll, rent, telephone, vendors, health insurance, worker’s comp, etc. Again, daily for the 1st 4 weeks, then weekly thereafter. We met every Wednesday – review the previous week’s predictions vs. actual and recast the next 13 Weeks.
First, we were petrified. Cash out was (generally) predictable. Cash in was not. We had big negative cash weeks, but we could see the light at the end. We started focus on profitable and steady sales growth and accounts receivable process and collection.
After time – we were more confident. We focused and improved on our A/R collection – developing a much better and accountable credit process. We smoothed out the sales cycle and production and became much more profit and cash oriented. A better, less stressful, and more valuable business.
I do this now with most of my clients – it not only get business owners focused on their cash flow, but more importantly takes some serious stress out of the business owner’s life.
No matter the size of your business, cash is king. I love George Cloutier’s book ‘Profits Aren’t Everything, They’re the Only Thing’ – but profit isn’t usable until it become cash. Also, when profits take a hit, intelligently using cash let’s you survive and keeps you in business.
If you have a cash flow process, I’d love to hear about it. If you don’t have a process in place – download my template and get started. It takes a month to get in the swing, but this straightforward process will make your life better and less stressful.
Think Cash!
/jon

Every organization who extends credit needs to have an effective credit policy, process, and procedure to protect their credit risk and to maximize cash flow.
Policy = rules, process = activities, procedure = specific instructions.
A better overall process certainly can drive sales and provide better customer value, but remember – profit isn’t true profit until you collect the cash!
Many companies I work with have a credit process, but it’s usually not formalized as a policy, process, and procedure. I strongly suggest all policies, processes, procedures be documented, reviewed/understood by your entire team, and used in training. It’s a great way to make significant improvements with operations – think efficiency, standardization, and franchise-like.
Outline your current credit policy, process and procedure; your external credit policies, your internal credit policies, and the credit granting and collection process and procedures. Spend time with your team for fully understanding and consistency – discuss improvements.
Forms used, depending on credit limits, generally include:
Most companies I look at can do a much better job improving cash flow by formalizing their credit policy, process and collection procedures.
As one of your cash flow drivers, measure and track your DSO metrics, and develop improvement strategies to improve results.
Remember the power of the Days Sales Outstanding ratio (DSO). In an $8mm company, an improvement from 46 days outstanding to 38 days results with approximately $175,000 of improved cash flow! Get to 30 days and it’s a $350,000 pick-up in cash.
Profit isn’t usable until you collect the money!

Here’s a simple truth: At all points of time, you are either growing or dying. This applies to our lives and our businesses. For me, dying doesn’t sound good; I’d rather be growing. I focus on constantly growing and getting better at what I do in every aspect of my life. I want to be growing, not dying!
I teach the same to my clients.
I was talking with one of my clients earlier this week on growing his $50mm energy services company. These guys process about 14,000 invoices per month with an average invoice ticket of approximately $300.
The only way to grow any business is to grow the number of customers, increase the average sales value, and/or increase the frequency of customer purchase. That’s it.
The key is to focus on improving each component.
I have used this simple formula with many types of companies including medical practices, construction companies, HVAC companies, truck parts distributors, job shop manufacturers, and technology resellers. It’s a simple formula and it works.
Once you understand the power of this, it will help really grow your business.
Consider the following formula.
Number of customers x Average sale price x Frequency of purchase per year = Revenue
I put together a program for one of my client’s segment and had some amazing results.
| Number of customers | 1,000 | 1,226 | |
| x Average sale price | 400 | 456 | |
| x Frequency of purchase per year | 7 | 7.5 | |
| Sales | 2,800,000 | 4,192,920 | 50% |
Notice the geometric growth – a 22% increase in number of customers and 14% increase in average sales with small increase in frequency of purchase gives a 50% increase in revenue.
For the energy service company I was speaking to earlier this week, we outlined a small increase in the number of customers 7% based on current growth trends and an additional service offering to increase the ASP $100 as follows:
| Current | Plan | Change | |
| Number of customers | 14,000 | 15,000 | 7% |
| x Average sale price | 300 | 400 | 33% |
| x Frequency of purchase per year | 12 | 12 | 0% |
| Sales | 50,400,000 | 72,000,000 | 43% |
I suggest you look back at the prior 12 months of sales and get your actual numbers. Don’t make assumptions here. Most business owners I talk to make assumptions as to the number of customers they have and ASP, but when we get the actual numbers, their assumptions invariably are wrong. Dump your invoice register to excel. De-dup the customers or compare to sales by customer. I also like to calculate average invoice value (total sales divided by total number of invoices). This may be be an easier stat for your sales reps to focus on.
Note – I love the simple trick in Excel to de-dup a list (data menu, remove duplicates), then use the sumif formula to get totals. I use this trick all the time.
Once you have your actual historical data, develop creative strategies and ideas to increase each element of the growth formula. Then EXECUTE a couple strategies and measure the results. Optimize, then repeat; test and measure.
It’s the only way to grow your business. Customers x ASP x purchase frequency = revenue.
Think growth and think profit,
/jon

Predicting and managing cash and cash flow is one of the most difficult things small businesses do.
If your company is growing, it’s important; we have all seen many growing companies blow-up and run out of cash as they’re going gang busters. If your company is not making money, it’s obviously paramount to survival. You need to watch every dollar – make payroll and keep the business operating.
I like to put two process tools in-place that really help any business predict and manage their cash flow.
The first tool which is essential for most small businesses is the ‘13 Week Cash Flow’. This should be updated, reviewed and revised every single week of the year. Put a reminder on your calendar.
The 13 Week Cash Flow worksheet is simple – it has weekly forecasts for cash receipts and a weekly forecast of cash disbursements. The trick twofold:
Predicting Cash Receipts
In smaller companies, I like to detail expected payments for all outstanding invoices. In the most companies, however, due to the size of receivable aging, assumptions must be made based on current expected cash conversion. Accounts receivable turnover is measured on a weekly basis and strategies are developed and implemented to make improvements. Small improvements in accounts receivable turnover has a dramatic effect on cash flow.
For example, a $10,000,000 parts distributor with $1,500,000 in accounts receivable, decreasing accounts receivable on average of days 5 days, increases cash approximately $139,000.
Disbursements
The worksheet needs to contain placeholders for every disbursement. Bi-weekly payroll, benefits, rent, debt payments, operating and admin expenses, A/P, inventory purchases, cap ex, debt and other payments. Look at your historical spends, open PO’s, current A/P. No surprises.
Each week, review the prior week’s worksheet with actual receipts and disbursements, and recast the next 13 weeks.
The process is straight forward and over time you get better at your predictions.
Forecasting cash flow in your business makes life much better. Less stress, more predictability, ability to make commitments, etc.
See an example of a 13 Week Cash Flow here with this simple Cash Flow Tool
The 2nd tool to predicting and managing cash and cash flow is an Operating Plan forecasting the basic financial statements: balance sheet, income statement and statement of cash flow. The Operating Plan uses key business drivers as its base.
I’ll discuss this in more detail later.
As always – Think Profit and Think Cash Flow!
/jon
We are all hustling to close our financial statements for last year. The auditors are coming in for their year end fieldwork. 2015 plans are being finalized with January as a bench post.
Seriously, by now most of us small and medium sized business owners have their internal year-end financials in hand (or half-year if you are a June 30 year-end) with your 2015 projections. If you don’t have yours year-end financials in-hand, get them done as soon as possible! If you don’t have an audit or a review by external accountants, prepare you books as you do. A solid year-end close is essential. Clean out the closets.
First, ensure all month-end procedures are complete and all balance sheet and income statement accounts are completely reconciled. Solid monthly closing procedures ensure timely and accurate month-end numbers. If this is an issue for your company, definitely make this an improvement goal for this year. A quick, accurate close is essential to run your company effectively. It’s impossible to make smart decisions without accurate numbers. If back end systems and processes are in place, the close process is clean and you can look at the critical numbers real-time.
Anyway – February is also a great time to look at your numbers. Monthly, business owners should compare actual month-to-date and year-to-date results to budget and to prior year. At year end, it is a great time to look at other key statistics as well.
For most businesses, I like to look at:
Once you have these actual numbers, drop them into a spreadsheet as follows:
| Basic Business Model | Actual per Year | Next Year Plan |
| Leads | 1,000 | |
| Conversion Rate | 80% | |
| Customers | 715 | 800 |
| Transactions per year | 24.00 | 24.00 |
| Average revenue per invoice | $ 246.00 | $ 300.00 |
| Revenue | 4,221,360 | 5,760,000 |
| Margin | 34.0% | 35.0% |
| Gross Profit | $ 1,43,262 | $ 2,205,000 |
| SG&A | $ 1,100,000 | $ 1,100,000 |
| Net income | $ 335,262 | $ 916,000 |
Note the small improvements in number of leads, conversion rate, and average transaction value have a huge increase in profitability. If you can increase the number of transaction per year, even better. I also like to track customer churn and work on strategies to decrease attrition.
Also, look at sales and gross margin by business segment and by customer. Several techniques can be used to including summarizing customer data in a matrix as follows.
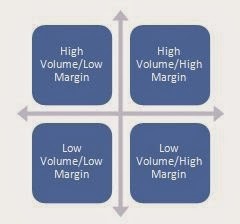
Work to move customers from the LV/LM quadrant.
Also, business owners need to review their balance sheet. Many small and medium sized business owners skip or skim over the balance sheet. Remember, the balance sheet is a snapshot in time of what your company owns and owes.
Important items on the balance sheet include leverage ratios, accounts receivable turnover, inventory turnover, and accounts payable payment days. All are straight forward calculations.
Note the power of cash flow with the follow example:
If you are a $20mm business with $2.2mm in accounts receivable, a 5-day improvement in receivable turnover means a $274,000 incremental increase in cash flow.
Several strategies can be employed to improve turnover statistics.
This is also great time to take another look at your upcoming year’s strategic plan and operating forecasts. Consider using some of these techniques to set monthly targets and goals.
If you need any help looking at your numbers, let me know – I love helping business owners improve their businesses.
As always – Think Profit!
/jon